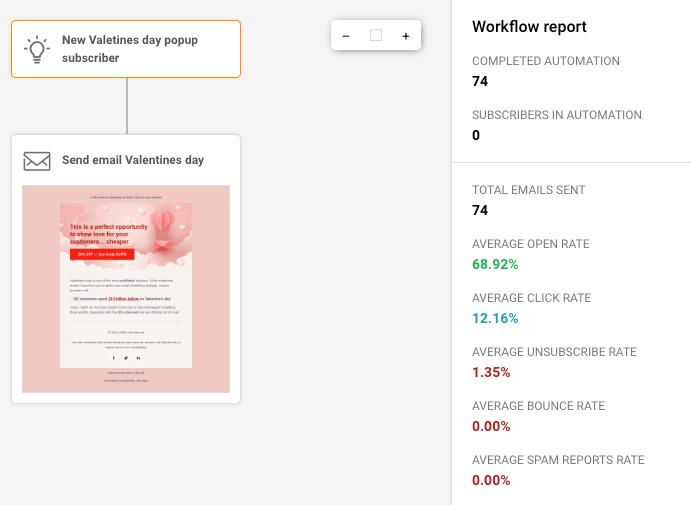
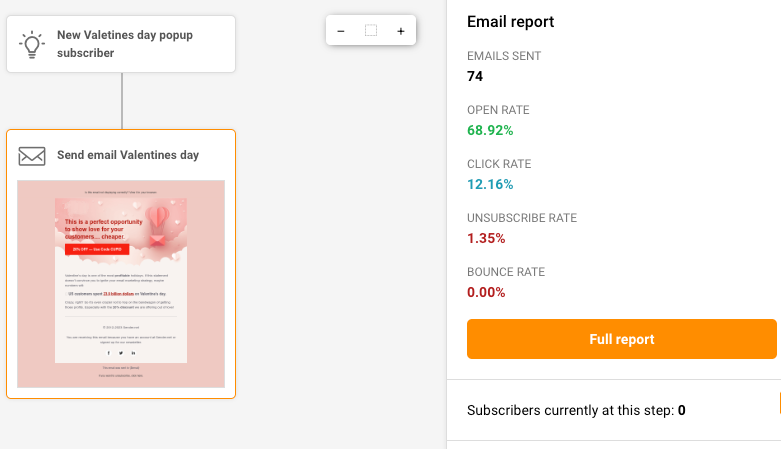
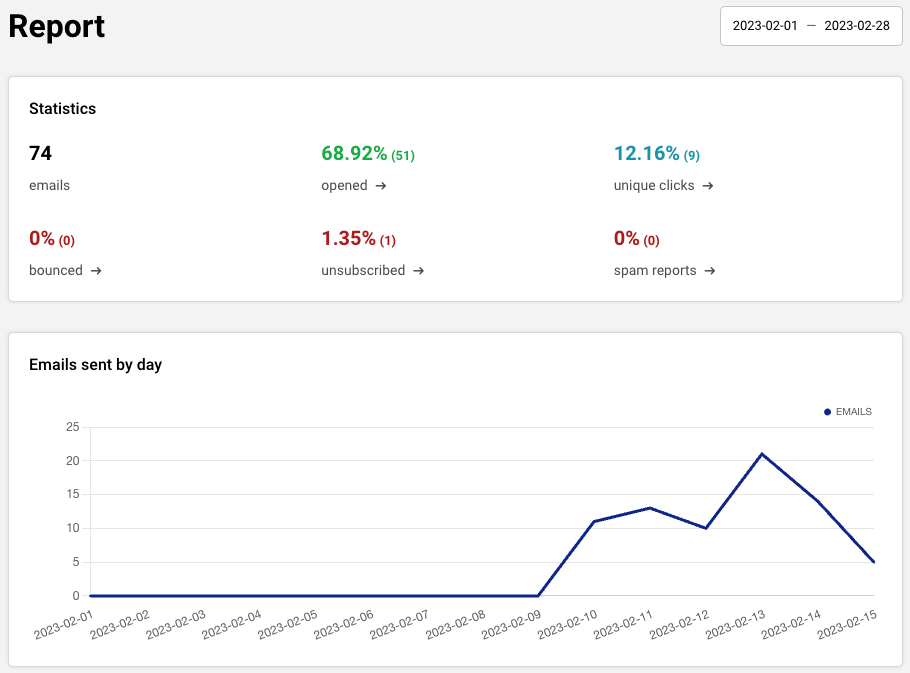
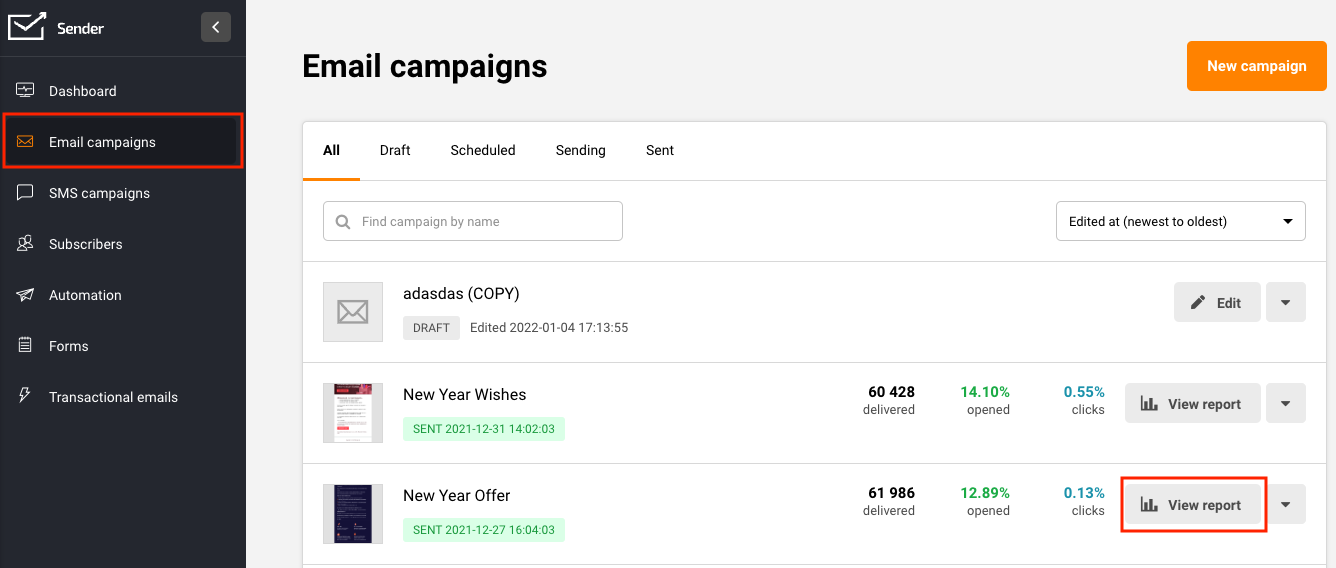
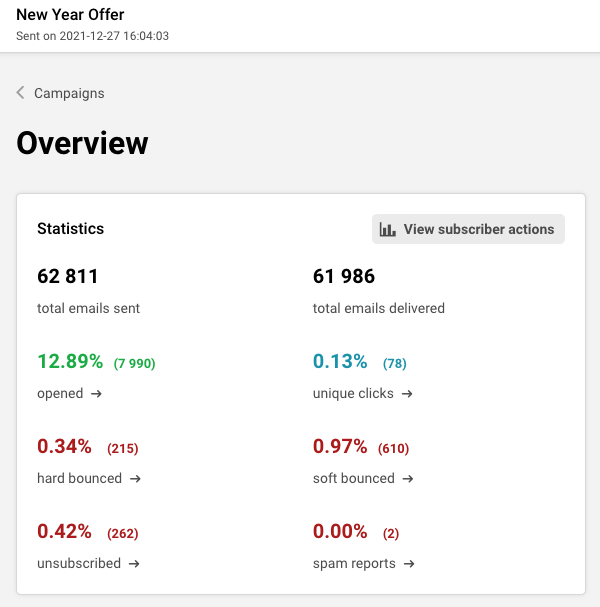
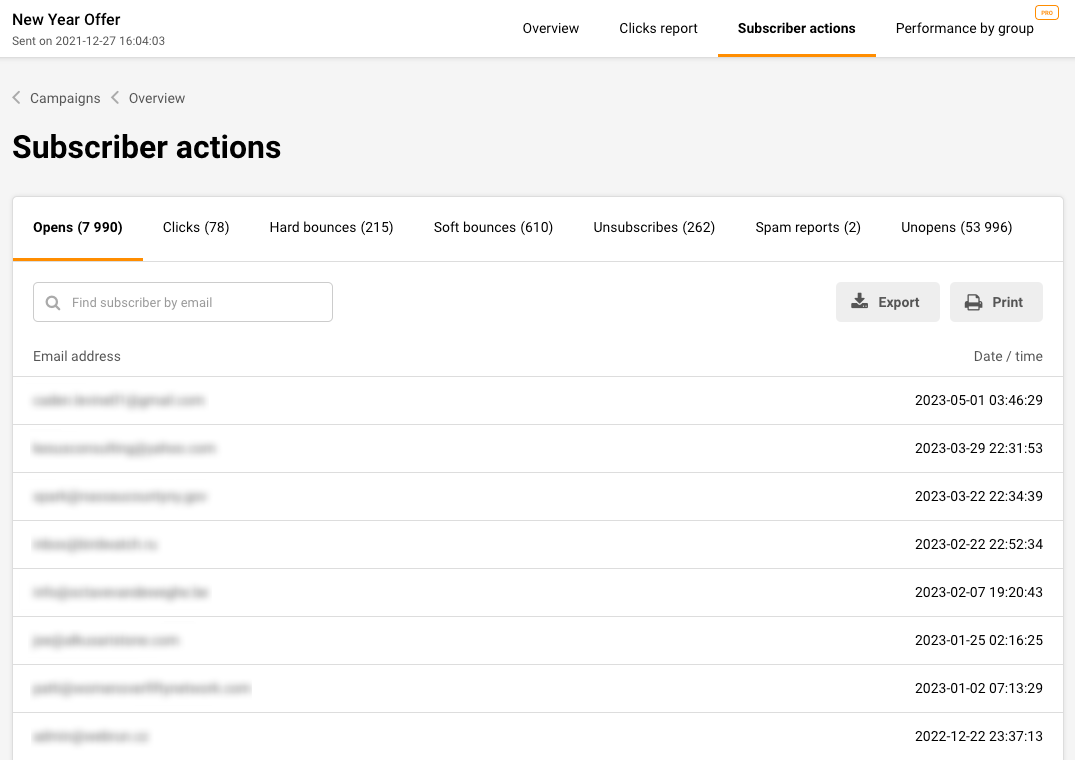
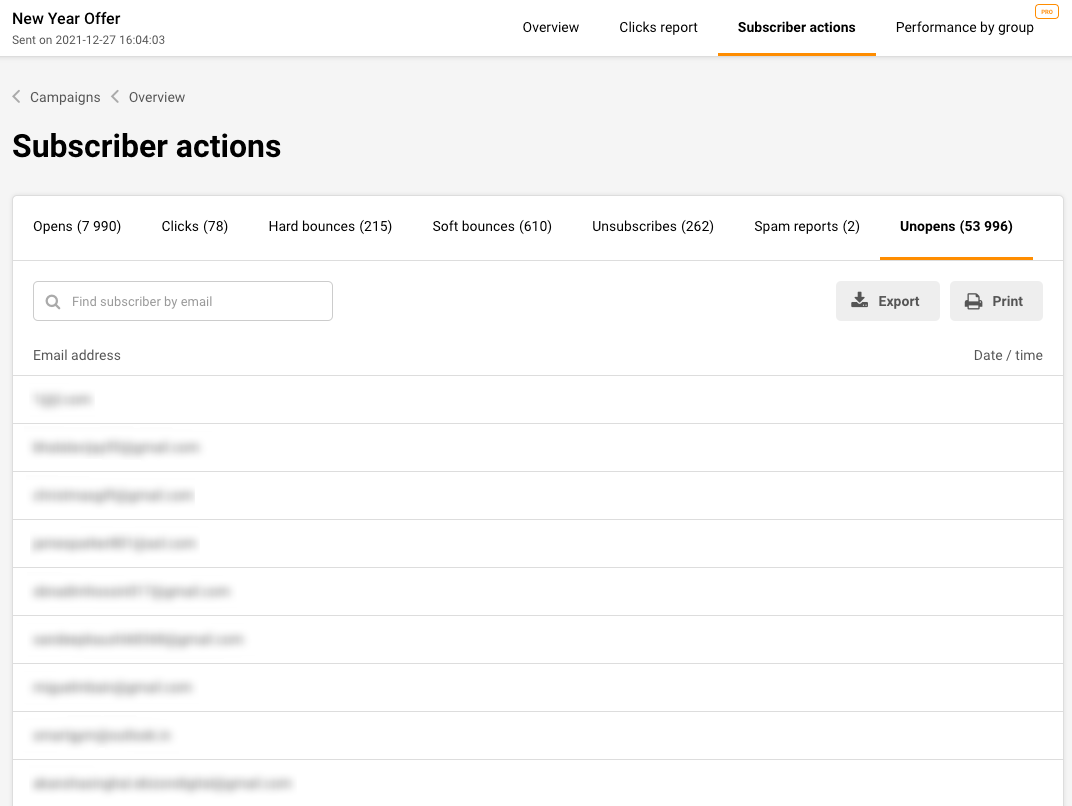
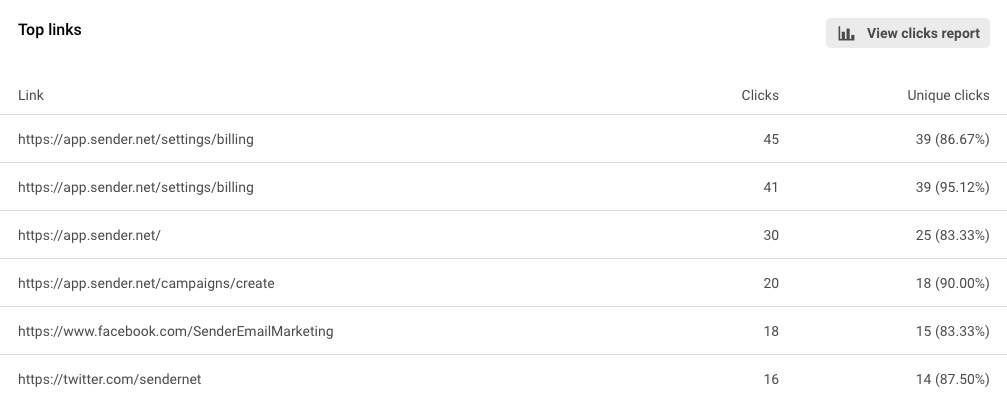
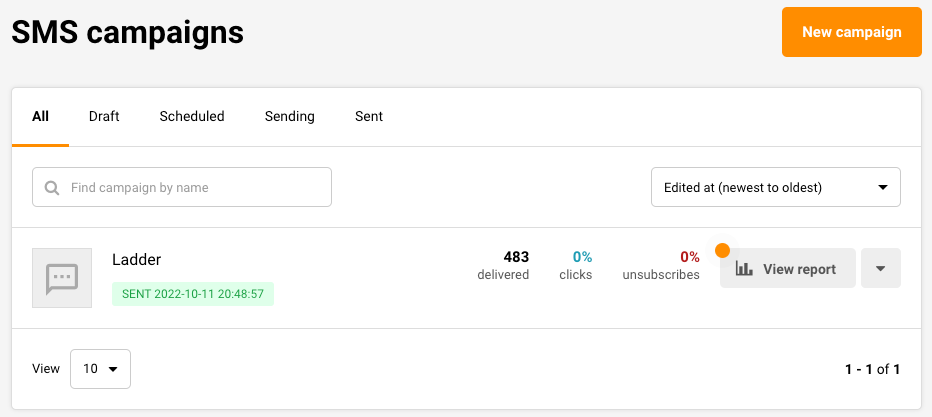
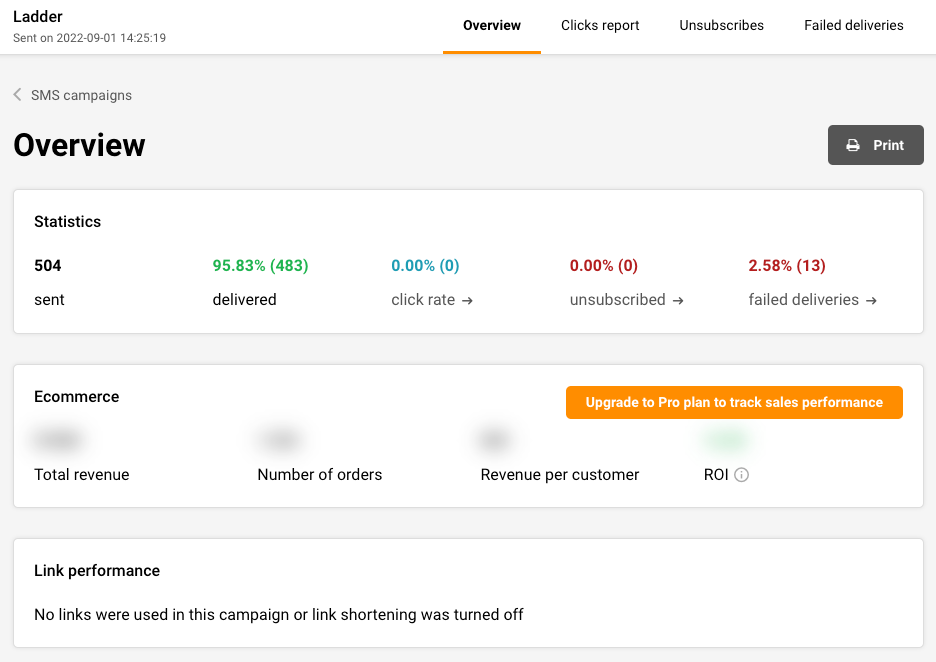
The same is integrated with your online Shopify store.
Form reports
Click “Forms” on the main dashboard to access the list of forms.
Clicking on “Overview” next to a specific form, will take you to detailed statistics for that instance of the form.
Please note that a graph is shown only if there has been new visitors and/or sign-ups in the past two weeks.
Automation reports
Click “Automation” on the main dashboard to access the list of workflows. Hit “View report” next to an automation to access data and analytics for the same.
To see the overall workflow performance, click the trigger step at the very top of the automation map.
To view the performance report of a particular step, click on the step in the map.
Next, hit the “Full Report” button on the dashboard to the right to generate detailed stats on what happened here.
Email campaign reports
Immediately after the campaign has been sent, the system begins tracking, analyzing data, such as clicks, opens, bounces, and unique clicks.
The reports are updated every few minutes so rest assured you get the very best of LIVE data to view and work with, at all times.
Click “Email campaign” -> On the campaign section, click “View report” to access the newsletters report.
The “Overview” section provides a convenient summary of your campaign’s key statistics. It covers:
Total emails sent — This is the total number of emails that were attempted to be sent;
Total emails delivered — This is the total number of emails actually delivered to the recipient email servers. Usually, unless there is a technical issue, this number should be the same as the total emails sent;
Opened — The number of emails opened by recipients. This is calculated by taking into account the total emails delivered (not accounting for hard or soft bounces);
Unique clicks — This shows you the number of unique clicks received on your campaign. If someone has clicked on a single link multiple times, Sender will count it as a single click only;
Hard-bounced — These are the incorrect or non-existent email addresses that could not be delivered to and hence should be cleaned from your list;
Soft-bounced — These are email addresses that could not be delivered to temporarily for technical reasons. Delivery will be attempted at least thrice before marking unreachable inboxes as hard bounces;
Unsubscribed — Subscribers who have chosen to opt out of your email campaigns for some reason;
Spam complaints (recipient’s reported spam) — These are contacts who have found your email marketing approach (for example, frequency) or content (for example, too aggressive or salesy) spammy and have reported you to their inbox provider such as Google, Yahoo etc.
Each of the above summary counters is clickable. Click to view comprehensive statistics about that category.
Clicking “View Subscriber Actions” will take you to a screen that will show you the break up by subscriber action taken. For example, by Opens, Clicks etc. Now you can tell which email addresses opened your email, which ones hard bounced and who opted out or marked you spam.
One interesting use case is that clicking on the “Unopened” tab will let you see the subscribers who have not opened your campaign.
Top links report: Sender tracks the performance of your links used in a particular campaign and presents this to you as shown below. It can be found by scrolling down in the overview section.
Clicks represent the total number of clicks received for that link while unique clicks are the number of unique subscribers who clicked.
Clicking on any of the links above will take you to the list of recipients who actually clicked on the link. You can export the list or add them all to a particular group.
Operating system, Platform and Browser report:
This report shows you the breakdown of your email campaign performance by the technology at the subscriber end e.g. the device, browser and operating systems being used to open the email.
Visualgraphs: Scroll some more down and you will see a graphical representation of the opens and clicks for this campaign by hour and by day.
Breakdown by geo-location: The report towards the bottom of the page shows the breakdown of your subscribers list by their email providers’ servers location.
SMS campaign reports
Click “SMS Campaigns” and then hit the “View report” next to the SMS campaign whose performance you would like to view.
Below in the overview section, you will find the following data counters:
Sent — Total number of text messages sent;(the amount of sent SMS campaigns);
Delivered — The number of text messages successfully delivered in this campaign;
Click rate — Percentage of recipients who clicked the link in your SMS;
Unsubscribed — Those who chose to opt out of your SMS campaigns;
Failed deliveries — These are the number of SMS recipients who could not be reached, either because of incorrect mobile numbers, the subscribers being out of range, or some other technical issues.
That’s it!
If you got stuck on a specific task or can’t find a way to execute a particular job, contact our support team via LiveChat or [email protected] – we’re here to help 24/7.
Get started with a free plan
With our Free Forever plan you can send emails to up to 2,500 of your subscribers.
Access to all features, including automation
Up to 15 000 emails per month to 2 500 subscribers